

I was recently helping an organization re-define their chart of accounts. They had a profit & loss statement 10 pages long and were having a hard time figuring out how the business was performing.
The business hosted events and provided various business educational programming. Each time they added a new event or program, they were creating new accounts—revenue and expense accounts. As the business grew, so did their P&L. The intention was a good one. They wanted to be able to review the results by program and event. However, as they added more and more accounts, it was getting difficult to decipher which data to review to drive results.
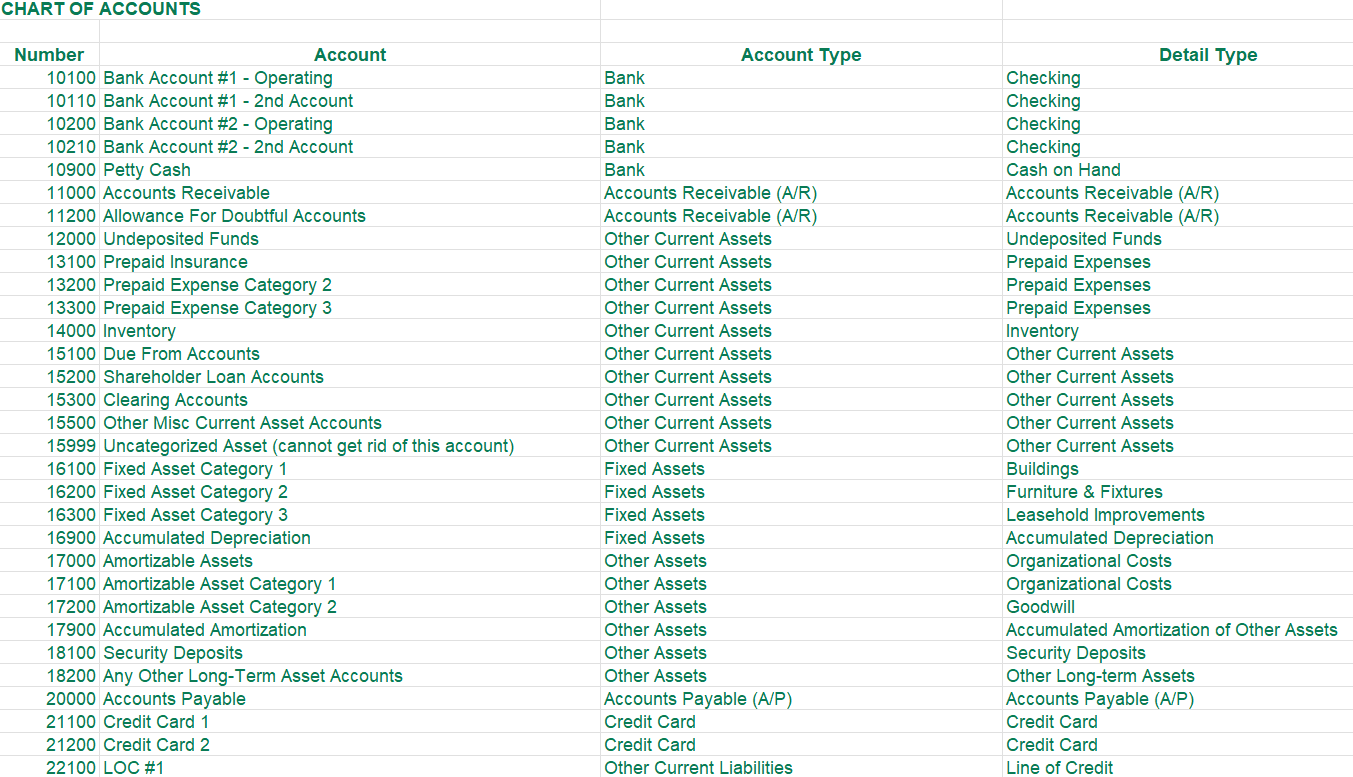
The Chart of Accounts organizes the accounting data in your business. As you consider how you want to organize your accounts, think about what information you need to have so that you are able to review performance, easily spot concerning results, and provide accurate information for compliance purposes.
If you have multiple service lines, you may want to have multiple revenue accounts—for example, Event Income and Program Income. However, you don’t need to have an account for every event and every program you provide. There are other ways to track specific event or program data (for example, in QuickBooks you can use projects), but you don’t need to have every event/program separated on your P&L. If you are going to track revenue in separate accounts for different service lines, and you have direct cost of sales associated with your revenue, you’ll also want to separate your cost of goods sold in the same way.
You may want to break down your cost of goods sold down a bit further. For example, instead of just Event Expenses and Program Expenses, you may have the following:
Event Expenses:
- Staffing Costs
- Venue Costs
- Other Costs
Program Expenses:
- Staffing Costs
- Materials and Supplies
- Other Costs
The goal is to have enough detail to evaluate the performance of the different areas of business, but not so many accounts that there is only a minimal amount of expense within each category.
EXAMPLE:
| CONSIDER THIS: | INSTEAD OF THIS: |
| Event Expenses: Staffing Costs Venue Costs Food & Beverage Costs Entertainment & Programming Other Costs | Event Expenses: Wait Staff Bar Staff Other Staff Venue Rental Venue Linen Venue Décor Food Beverage Speaker Music AV Rental Internet Rental Entertainment & Programming Other Costs |
The first option streamlines your reporting and consolidates the staffing costs, venue costs, food & beverage expenses, and entertainment costs, versus breaking it all out into every thing you might pay for. You decide what works best for you and if you need additional break-down, it is not wrong to have it. However, there are multiple reasons why simpler is better.
- The more accounts you have, the more likely it is that something gets recorded in the wrong place.
- It takes longer to manage your bookkeeping, because you’re constantly referencing where something might go or trying to figure out if there is a separate account for that.
- The amounts recorded in some of these accounts—for example, Venue Linen—will likely be very small and not provide much value.
When it comes to organizing your Chart of Accounts, simple is better. You can always add accounts, but really consider what makes sense for your business before you do. Your COA should organize your financial data so that it tells the story of your business.
To learn more about designing your chart of accounts and financial reporting, check out the Accounting module in our Small Business Bootcamp. We have additional resources included in our THRIVE Network, including a Chart of Accounts template and detailed tutorial.


© Copyright The Small Business CEO | all rights reserved
